
The mindboggling concessions given to the super-rich discussed in the previous article (published in Janata Weekly) have led to a massive increase in their wealth.
When the Modi Government came to power in 2014, the Forbes’ list[1] had 56 Indian billionaires with a combined wealth of $191.5 billion.[2] A decade later, there were 200 Indians on the 2024 Forbes’ list of the world’s billionaires. Their combined wealth is approaching a trillion dollars, with a record total of $954 billion. India now has the third largest number of billionaires in the world, behind USA and China.[3] This is equivalent to Rs. 79.71 lakh crore.[4] This amount is equivalent to a quarter of India’s GDP for 2024.
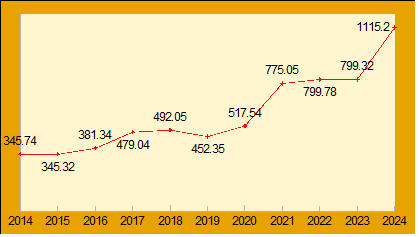
In October, Forbes’ reported that the total net worth of India’s 100 wealthiest tycoons has tripled in the last decade and their wealth had crossed $1 trillion (Chart 17.1).
Chart 17.1: India: Net Worth of 100 Richest Indians, 2014–2024 ($ billion)[5]

Another well-known list of the world’s billionaires is the Hurun Rich List, published by Hurun Report, a research, publishing and events group based in London. The Hurun India Rich List publishes a list of Indians with net worth of more than Rs. 1,000 crore. The total number of ultra-wealthy on this list has gone up by 4 times during the Modi years — from 230 in 2014 to 1,539 in 2024.[6] Anas Rahman Junaid, Chief Researcher of Hurun India, says that “Assuming that for every one Hurun rich lister we have found, we have probably missed two, India today likely has 5,000 individuals worth Rs. 1,000 crore.”[7]
At the same time, even official reports by international agencies admit that India also has the largest number of poor people in the world. According to a recent report by United Nations Development Programme (UNDP) and the Oxford Poverty and Human Development Initiative (OPHI) based at the University of Oxford, India accounts for a quarter of the total people in the world living in acute poverty — 234 million out of 1.1 billion.[8] We have pointed out in Article 3 of this budget analysis series that even this dismal figure is a gross underestimate, and that more than half of the country’s population is living in poverty.
Deepening Inequality: The Billionaire Raj
A more accurate estimation of the deepening inequality between the rich and poor in India because of the corporate plunder of the country’s wealth and natural resources facilitated by the Modi Government has been made in a recent study published by the World Inequality Lab titled ‘Income and Wealth Inequality in India 1922–2023: The Rise of The Billionaire Raj’. The study says that India has today become one of the most unequal countries in the world:
- By the end of 2023, India’s richest 1 percent people had a 22.6 percent share of national income, the highest in over a century, while the bottom 50 percent of the population had a 15 percent share.
- Wealth inequality in India is also near historic highs: by the end of 2023, India’s richest 1 percent citizens owned 40.1 per cent of the country’s wealth, the highest since 1961, while the bottom 50 percent owned only 6.4 percent of the total wealth.[9]
The paper is authored by Thomas Piketty (Paris School of Economics and World Inequality Lab), Lucas Chancel (Harvard Kennedy School and World Inequality Lab) and Nitin Kumar Bharti (New York University and World Inequality Lab). The authors say:
“The ‘Billionaire Raj’ headed by India’s modern bourgeoisie is now more unequal than the British Raj headed by the colonialist forces.”[10]
Income Inequality
We give two tables from the above mentioned study to give a sense of how skewed income distribution has become in the country. Table 17.1 presents a summary of the income inequality in India in 2022–23. In Chart 17.2, we present the same data in a graphical format as it helps in better visualisation of the data. As can be seen from Table 17.1:
- The share of national income going to the top 10 percent has reached astonishingly high levels and is touching 60 percent in recent years (it was 57.7 percent in 2022).
- Within the top 10 percent, there is an increasing concentration of wealth at the very top:
- The top 1 percent share reached an all-time high of 22.6 percent in 2022.
- The top 0.1 percent earned nearly 10 percent of the national income.
- At the other end of the distribution, the bottom 50 percent were getting only 15 percent of India’s national income in 2022–23.
Table 17.1: Income Inequality in India, 2022–23 [11]
| Income Group | Adults | Income Share (%) | Threshold Income (Rs.) | Average Income (Rs.) | Ratio to Average |
| Average | 92,23,44,832 | 100 | 0 | 2,34,551 | 1.0 |
| Bottom 50% | 46,11,72,416 | 15.0 | 0 | 71,163 | 0.3 |
| Middle 40% | 36,89,37,933 | 27.3 | 1,05,413 | 165,273 | 0.7 |
| Top 10% | 9,22,34,483 | 57.7 | 2,90,848 | 13,52,985 | 5.8 |
| Top 1% | 92,23,448 | 22.6 | 20,73,846 | 53,00,549 | 22.6 |
| Top 0.1% | 9,22,345 | 9.6 | 82,20,379 | 2,24,58,442 | 95.8 |
| Top 0.01% | 92,234 | 4.3 | 3,46,06,044 | 10,18,14,669 | 434.1 |
| Top 0.001% | 9,223 | 2.1 | 20,01,98,548 | 48,51,96,875 | 2,068.6 |
Table 17.1 also shows that the income inequality in the country is so stark that:
- It takes just 2.9 lakhs per year to make it to the top 10 percent of income earners; and
- 20.7 lakhs to make it to the top 1 percent.
In contrast:
- the median adult earns only around 1 lakh — that is, if you are earning Rs. 1 lakh per year, you enter the top 50 percent of the income earners; and
- the poorest of the poor have virtually no incomes.
Chart 17.2: Income Inequality in India, 2022–23 [12]

The gap between the average income of the rich and the poor is staggering:
- the bottom 50 percent have an average income of just around Rs. 70,000 per year (which works out to less than Rs. 6,000 per month);
- the top 0.1 percent comprising 9.2 lakh adults have an average income of Rs. 2.25 crore per annum; and
- the top 0.001 percent (the richest ∼ 10,000 individuals) have an average annual income of Rs. 48.5 crore.
Wealth Inequality
Table 17.2 summarises the findings of the World Inequality Lab study on wealth inequality in India, and Chart 17.3 presents it in graphic format. A comparison of Tables 17.1 and 17.2 makes it evident that wealth inequality in the country is even more severe:
- The share of the top 10 percent in the total national wealth has increased to 65 percent in 2022–23.
- Within the top 10 percent, there is an increasing concentration of wealth at the very top. In 2022–23, of the total national wealth:
- the top 1 percent wealth share was 39.5 percent;
- the top 0.1 percent had a share of 29 percent;
- the top 0.01 percent had a share of 22 percent; and
- just the top 0.001 percent had a share of 16 percent.
- At the opposite end, the share of the bottom 50 percent in the total national wealth had fallen to just 6 percent in 2023.
Table 17.2: Wealth Inequality in India, 2022–23 [13]
| Wealth group | Adults | Wealth Share (%) | Threshold(Rs.) | Average Wealth (Rs.) | Ratio to Average |
| Average | 92,23,44,832 | 100 | –4,10,00,000 | 13,49,029 | 1 |
| Bottom 50% | 46,11,72,416 | 6.4 | –4,10,00,000 | 1,73,184 | 0.1 |
| Middle 40% | 36,89,37,933 | 28.6 | 4,31,138 | 9,63,560 | 0.7 |
| Top 10% | 9,22,34,483 | 65.0 | 21,98,344 | 87,70,132 | 6.5 |
| Top 1% | 92,23,448 | 40.1 | 81,60,022 | 5,41,41,525 | 40.1 |
| Top 0.1% | 9,22,345 | 29.7 | 5,26,17,860 | 40,04,54,807 | 296.8 |
| Top 0.01% | 92,234 | 22.2 | 36,86,80,160 | 2,99,67,73,491 | 2,221.4 |
| Top 0.001% | 9,223 | 16.8 | 2,75,66,99,904 | 22,61,33,54,928 | 16,762.7 |
Table 17.2 shows that wealth inequality in the country is so appalling that the median adult holds just Rs. 4.3 lakh worth of wealth — this means that if you own wealth totalling Rs. 4.3 lakh wealth, you are in the top 50 percent of the wealth owners.
Chart 17.3: Wealth Inequality in India, 2022–23 [14]

The wealth gap between the richest and the poorest is simply stunning:
- the top 0.1 percent have an average wealth of Rs. 40 crore.
- the wealthiest ∼ 10,000 individuals out of 92 crore Indian adults own an average of Rs. 2,260 crore in wealth;
- while the bottom 50 percent (46 crore individuals) have an average wealth of Rs. 1.7 lakh;
- and the poorest have almost no wealth.
The authors of this report point out that even these figures of extreme income and wealth concentration are only conservative estimates:
[O]ur benchmark estimates are plausibly conservative in the sense that we might be underestimating the true extent of income and wealth concentration in recent years.
For instance, we are unable to account for offshore wealth when estimating the wealth distribution. We know, however, that over 1 percent of India’s GDP worth of wealth is parked as offshore assets by Indians in Dubai alone. Further, Indians account for over 20 percent of all foreign-owned real estate in Dubai. These strongly indicate that we are likely under-estimating wealth at the very top of the distribution.[15]
{Note that this income and wealth concentration is not entirely due to the Modi Government’s policies. Its economic policies have only accelerated income and wealth concentration in the country. In this book, we have focussed only on the economic policies of the past decade. But the reality is that this wealth concentration began with the onset of globalisation–liberalisation–privatisation or what are also known as neoliberal policies since the early 1990s, introduced by the Narasimha Rao – Manmohan Singh Congress government following the external debt crisis of 1990–91. Till then, during the first four decades after independence, the income and wealth concentration had declined in the country, a reflection of the commitment of our rulers to the economic policies outlined in the Directive Principles of the Constitution. The income concentration of the top 1 percent declined from 14.1 percent in 1957 to only 10.2 percent in 1991, but after that, because of neoliberal economic policies, doubled to 21.3 percent by 2014. Likewise, during the period 1961 to 1991, wealth concentration in the country did not change much. But after that, the wealth concentration with the top 1 percent doubled over the period 1991 to 2014, from 16.1 percent to 33.3 percent.[16]}
Notes
1. An annual ranking by documented net worth of the world’s wealthiest billionaires by the American business magazine, Forbes.
2. “Global Billionaire Wealth Scales New Heights; India Disappoints: Forbes”, 4 March 2014, https://www.thehindubusinessline.com.
3. “Indian Billionaires Soar to Record Highs”, 3 April 2024, https://www.forbes.com; “Forbes Richest World’s Billionaires List 2024”, https://www.forbes.com.
4. Average value of US dollar to Indian rupee for January to November 2024 is Rs. 83.55.
5. “India’s 100 Richest 2024: Fortunes of Indian Tycoons Jump 40% Blowing Past $1 Trillion”, 9 October 2024, https://www.forbes.com.
6. “Hurun India Rich List 2024: Gautam Adani at #1, Billionaire Count Crosses 300, Cumulative Wealth & More”, 29 August 2024, https://www.livemint.com.
7. “Shah Rukh, Adani, Ambani in Hurun Rich List: Wealth of Indian billionaires More Than GDP of Saudi Arabia & Switzerland”, 29 August 2024, https://economictimes.indiatimes.com.
8. “India Among Five Countries with Largest Number of People Living in Poverty: UN Report”, 18 October 2024, https://economictimes.indiatimes.com.
9. In the study, incomes refer to annual flows earned from individuals’ labour or flows generated by capital they own (e.g. rent, dividends, interests or retained earnings). These are measured before income taxes, i.e. pre-tax incomes. Wealth refers to stocks, that are the market value of assets owned by individuals (such as housing, equity or directly owned businesses) net of any debt.
10. Nitin Kumar Bharti, Lucas Chancel, Thomas Piketty, and Anmol Somanchi, “Income and Wealth Inequality in India, 1922–2023: The Rise of the Billionaire Raj”, March 18, 2024, https://wid.world.
11. Ibid., p. 40.
12. We have converted data from Table 17.1 into graphic format.
13. Nitin Kumar Bharti, Lucas Chancel, Thomas Piketty, and Anmol Somanchi, “Income and Wealth Inequality in India, 1922–2023: The Rise of the Billionaire Raj”, p. 40, op. cit.
14. We have converted data from Table 17.2 into graphic format.
15. Nitin Kumar Bharti, Lucas Chancel, Thomas Piketty, and Anmol Somanchi, “Towards Tax Justice & Wealth Redistribution in India: Proposals Based on Latest Inequality Estimates”, p. 4, World Inequality Lab, May 2024, https://wid.world.
16. Nitin Kumar Bharti, Lucas Chancel, Thomas Piketty, and Anmol Somanchi, “Income and Wealth Inequality in India, 1922–2023: The Rise of the Billionaire Raj”, pp. 71 and 76, op. cit.
(Neeraj Jain is a social–political activist with an activist group called Lokayat in Pune, and is also the Associate Editor of Janata Weekly, a weekly print magazine and blog published from Mumbai. He is the author of several books, including ‘Globalisation or Recolonisation?’ and ‘Education Under Globalisation: Burial of the Constitutional Dream’.)