
Union Budgets 2014 to 2024 – Article 7:
Reduction in Social Sector Expenditures
Neeraj Jain
Public Social Sector Expenditures: India vs Other Countries
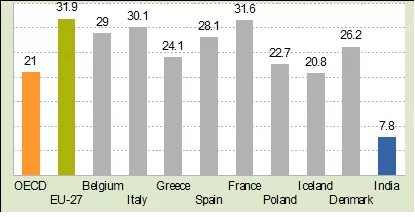
Most developed countries have a very elaborate social security network for their citizens, including unemployment allowance, universal health coverage, free school education and free or cheap university education, old age pension, maternity benefits, disability benefits, family allowance such as child care allowance, allowances for those too poor to make a living, and much more. Governments spend substantial sums for providing these social services to their people. The average public expenditure on social services of the 34 countries of the OECD has been around 21 percent of GDP for the last many years, and for the EU–27 has been even higher at nearly 32 percent of GDP. In contrast, Government of India’s expenditure on social services (Centre and States combined) is less than 8 percent of GDP (see Chart 7.1).
Since the per capita GDP of the developed countries is much more than India, so the per person social sector spending of the developed countries is many times more than that reflected by the above figures.
Chart 7.1: Social Sector Expenditure as % of GDP, 2022 [1]

Reduction in Welfare Spending During Modi Years
There are two important heads under which the government spends money on people:
- Subsidies: The most important subsidies given by the government as defined in its budget documents are food subsidy, fertiliser subsidy, and petroleum (LPF and kerosene) subsidy.[2]
- Social Sector Expenditures: Budget outlay for social sector ministries that directly benefit the people.
As we have pointed out in Article 5 of this budget series (published in Janata), because of low direct taxes and huge subsidies to corporate houses, Centre’s revenues are low. The budget outlay over the last 4 years (2020–21 A to 2024–25 BE) has increased by a CAGR of only 8.26 percent, which means it has increased only marginally in real terms; and the budget outlay as a percentage of GDP has actually fallen by nearly 3 percentage points over this period (see Chart 5.10).
Within this stagnant budget outlay, the FM has made a huge increase in the Centre’s capital expenditure (capex) for four successive years. Consequently, capital expenditure as a percentage of budget outlay has nearly doubled over this period: from 12.1 percent in 2020–21 (Actuals) to 23 percent in this year’s budget estimate. We have explained in Article 6 of this budget series (published in Janata Weekly) that capital expenditure is yet another way by which the Modi Government is transferring public funds to big corporate houses.
To compensate for the increase in capex, the FM needs to reduce the budget spending on some other heads. The axe has fallen on welfare spending on the poor.
i) The Subsidy Bill
The Modi Government’s expenditures on subsidies on food, fertilisers and petroleum are given in Table 7.1.
Table 7.1: Modi Govt’s Expenditure on Subsidies, 2019–20 to 2024–25 (Rs. crore) [3]
As can be seen from the table, the pandemic (2020–21) saw a significant rise in the government’s subsidy bill, especially because of the huge increase in distribution of free foodgrains to the people badly affected by the unplanned lockdown. Since then, the subsidy bill of the Modi Government has sharply declined. The total expenditure on food, fertiliser and petroleum subsidies for 2024–25, even in nominal terms, is nearly half (54 percent) of that for 2020–21A.
Chart 7.2: Modi Govt’s Expenditure on Subsidies, 2014–15 to 2024–25 (Rs. crore) [4]
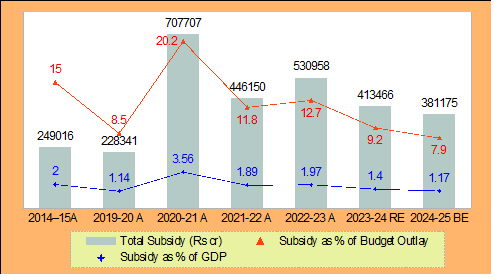
A better picture of the Modi Government’s spending on subsidies is obtained from Chart 7.2. The chart brings out in bold relief that the Modi Government had steeply reduced its subsidy bill during its first term — as a percentage of budget outlay, the subsidy bill had declined by 43 percent over the years 2014–15 to 2019–20 (from 15 percent to 8.5 percent). The pandemic forced the government to increase its subsidy bill in 2020–21 — mainly because of an increase in food subsidy spending that increased by more than 5 times, from Rs. 1.09 lakh crore to Rs. 5.41 lakh crore. Since then, despite the non-agricultural unorganised sector — that accounts for nearly 50 percent of the total employment — continuing to be in crisis, the Modi Government has again drastically reduced its spending on subsidies. The cut has been so steep that when compared to the allocation for 2014–15, the total subsidy in 2024–25 BE as a percentage of budget outlay has come down by nearly half (from 15 percent to 7.9 percent), and as a percentage of GDP it has declined by 40 percent (from 2 percent to 1.17 percent)!
ii) Reduction in Social Sector Expenditure
There is no standard definition of the ‘social sector’. The Economic Surveys give a vague definition of the social sector.[5] Further, they give data on combined social sector expenditures of the Centre and States, from which it is not possible to deduce the Centre’s social sector spending.
The Centre for Policy Research (CPR), a leading Indian think tank that focuses on public policy,[6] has made an estimate of the Centre’s social sector expenditures. But its website also does not specifically mention the ministries that it has included in its definition. It only says: ‘social sector’ refers to education, rural development, health, water and sanitation, nutrition, social security and social justice, food security, urban poor welfare, tribal and minority affairs, employment, skill development, women and child welfare, sports and culture.[7]
So, we have drawn up a list of departments and ministries whose combined budget outlay can be considered to be the total social sector expenditure of the Government of India. These include:
- Department of Food and Public Distribution
- Department of Health and Family Welfare
- Ministry of Ayush
- Ministry of Culture
- Ministry of Education
- Ministry of Environment, Forests and Climate Change
- Ministry of Housing and Urban Affairs
- Ministry of Jal Shakti
- Ministry of Labour and Employment
- Ministry of Minority Affairs
- Ministry of Rural Development
- Ministry of Skill Development and Entrepreneurship
- Ministry of Social Justice
- Ministry of Tribal Affairs
- Ministry of Women and Child Development
- Ministry of Youth Affairs and Sports
We give our estimate of the social sector expenditures of the Central Government in Table 7.2. In the same table, we also present the estimate made by CPR of the Centre’s social sector expenditures (the CPR only gives the social sector expenditures as a percentage of the budget outlay). As can be seen from the table, our estimates closely match CPR’s estimate.
Table 7.2: Modi Government’s Social Sector Expenditures, 2019–20 to 2024–25 (Rs. crore)[8]
| 2019–20 A | 2020–21 A | 2021–22 A | 2022–23 A | 2023–24 RE | 2024–25 BE | |
| Social Sector Exp. – Our estimate (1) | 5,24,957 | 10,45,798 | 8,94,780 | 8,48,310 | 8,43,666 | 8,80,125 |
| (1) as % of Budget Outlay | 19.54 | 29.80 | 23.59 | 20.23 | 18.79 | 18.26 |
| Social Sector Exp. as % of Budget Outlay – CPR figure | 20 | 30 | 24 | 20 | 19 | 18 |
As can be seen from Table 7.2, the Modi Government’s expenditure on social services has continuously declined from 2020–21 A to 2023–34 RE in nominal terms. It has increased in this year’s budget estimates, but is still below the level reached in 2021–22; and is 16 percent less than the social sector expenditure in 2020–21!
These figures do not reflect the full extent of the cut made by the Modi Government in its social sector outlay. That is better reflected in Chart 7.3. The chart gives the social sector expenditures of the Centre as a percentage of the total budget outlay, and as a percentage of the GDP. Both have drastically fallen — as a percentage of the total budget expenditure, the social sector budget for 2024–25 (18.26 percent) is less than that for 2020–21 (29.8 percent) by 39 percent; and as a percentage of the GDP, it has halved (from 5.27 percent to 2.7 percent)!
Chart 7.3: Modi Govt’s Social Sector Expenditures*, 2019–20 to 2024–25 (Rs. crore)
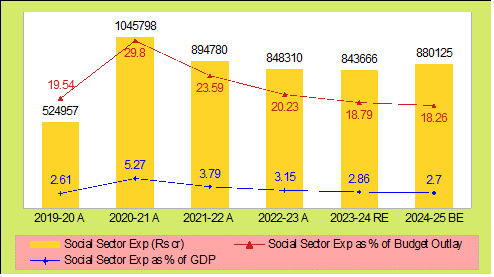
* Our estimate
Violation of Federalism: Reduction in Central Transfers to States
Another way in which the Modi Government has sought to compensate for its low revenues is by reducing its transfers to the States, in violation of the country’s federal structure.
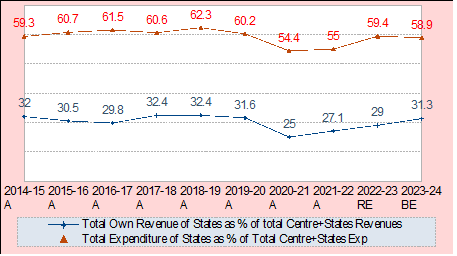
The Constitution grants the Union government more revenue raising powers. Therefore, the Centre collects the bulk of the revenues in the country; the States do not have many sources of revenue. This has got further skewed after the imposition of GST, which has further restricted the sources of revenues of the States. As we can see in Chart 7.4, of the total revenues of the Centre and States (including Centre’s borrowings), the Centre collects around 70 percent, and the States the remaining 30 percent (the States’ share had fallen to as low as 25 percent in 2021–22 and 27.1 percent in 2022–23). On the other hand, the Constitution tasks the States to undertake most of the development and welfare-related responsibilities. Of the total expenditure undertaken by the Centre and State governments, the States spend an average of 59 percent (average of 2014–15 to 2023–24 BE).
Chart 7.4: Own Revenues of States as % of Total Revenue of Centre and States, and Total Expenditure of States as % of Total Expenditure of Centre and States,2014–15 A to 2023–24 BE [9]
This allocation of revenue raising powers and expenditure responsibilities results in an imbalance, and so the Constitution has made a provision for the setting up of a Financial Commission to determine the sharing of revenues between the Centre and the States. Successive Finance Commissions (FC) have attempted to reduce this imbalance by increasing the States’ share in Central taxes. The 14th FC recommended that the share of States in gross tax revenues (GTR) of the Centre be 42 percent (for the period 2015–20), while the 15th FC marginally lowered this to 41 percent (for the period 2021–26). (The adjustment of 1 percent is to provide for the newly formed union territories of Jammu & Kashmir and Ladakh from the resources of the Centre.)
The Modi Government accepted both these recommendations. But it has resorted to a simple trick to deny the States their rightful share in Central revenues. Presently, as per the Finance Commission recommendations, the States are supposed to receive 41 percent of the ‘Divisible Pool’ of Centre’s tax revenues. But there is a loophole in this that enables the Centre to transfer a lesser portion as taxes — taxes collected by the Centre in the form of cesses and surcharges are not included in the ‘Divisible Pool’ and are therefore not shared with the States:
- Divisible Pool of Centre’s revenues = [Gross Tax Revenues of Centre (GTR) – Cesses and Surcharges – Expenses incurred for collecting taxes]
- States’ Share of Centre’s Tax Revenues = Divisible Pool of Centre’s Revenues x 41/100
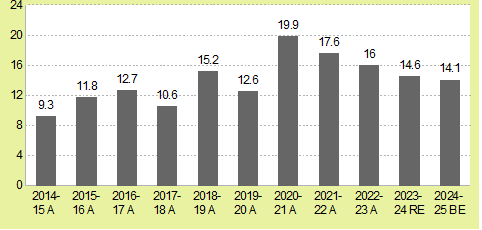
The Modi Government is blithely exploiting this ambiguity. It has been collecting more and more of its GTR as surcharges and cesses, to reduce its transfers to the States. During the first 7 years of the Modi Government, the share of cesses and surcharges in the Centre’s GTR (excluding the GST compensation cess which is exclusively given to the States) actually doubled, from 9.3 percent in 2014–15 to 19.9 percent in 2020–21. After that, their share has declined, but still remains at a high of 14.6 percent in last year’s RE and 14.1 percent in this year’s BE (Chart 7.5).
Chart 7.5: Cesses and Surcharges as % of Gross Tax Revenues of Centre, 2014–15 to 2024–25 [10]
With the shrinking of the divisible pool, the share of the Centre’s GTR going to the States has stagnated, while the Centre’s kitty has continued to rise. This can be seen from Chart 7.6. Note that even during the pandemic years, 2019–20 and 2020–21, when the GTR took a hit, the States’ share in the GTR of the Centre (this is also called ‘Devolution of States share in taxes’ in the Union Budget papers) recorded a steep fall of 15 and 19 percent respectively, but the Centre’s revenues continued to rise because the Centre beefed up its revenues by hiking cesses and surcharges, which are not shareable with the States.
Chart 7.6: Distribution of Gross Tax Revenue Between Centre and States, 2014–15 to 2024–25 (Rs. crore)[11]
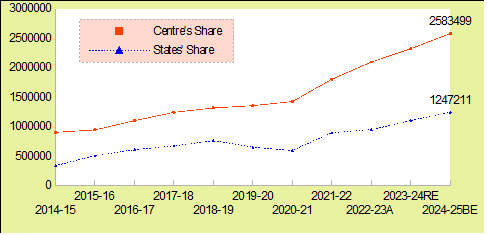
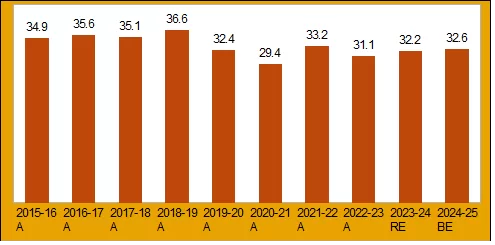
Consequently, the actual share of the States in the GTR of the Centre has never reached the mandated level of 41–42 percent. The 14th FC recommendations came into effect from 2015–16. As we can see from Chart 7.6, the transfers to the States as percentage of Centre’s GTR have been well below the recommended level for the entire period from 2015–16 to 2024–25 BE. They increased from 34.9 percent in 2015–16 to 36.6 percent in 2018–19 A, before declining to even below the 2015–16 level, and are at 32.6 percent in 2024–25 BE. The gap between the share recommended by the FC and the actual devolution is a huge 8.4 percentage points in 2024–25 BE (Chart 7.7).
Chart 7.7: State’s Share in Gross Tax Revenues, 2015–16 to 2024–25 (%)[12]
Let us calculate the revenue loss of the States for 2023–24, due to this undemocratic behaviour of the Centre, which goes against the federal spirit of the Constitution:
- For 2024–25, total gross tax revenues of the Centre = Rs. 38.31 lakh crore [we have deducted the amount transferred to NCCF/NDRF from GTR];
- 41 percent of this = Rs. 15.71 lakh crore;
- Actual amount transferred to States from gross tax revenue (as per this year’s Union Budget documents) = Rs. 12.47 lakh crore
The States are going to suffer a loss of 20.6% (amounting to Rs. 3.23 lakh crore) in their share of Central tax revenues as mandated by the FC in FY 2024–25, due to the Centre resorting to collecting revenues through cesses and surcharges instead of taxes.
Even constitutional institutions such as the RBI and the CAG have adversely commented on this denial to the States of their rightful share of Central tax revenues. In 2019, the Reserve Bank of India (RBI) had noted that levying cesses and surcharges neutralises the increase in tax devolution recommended by successive Finance Commissions. Both the 14th and the 15th Finance Commissions have also expressed their disapproval of the Centre collecting an increasing amount of revenues through cesses.[13]
With the Centre resorting to tricks to reduce the tax transfers to the States, they are being pushed into a corner, and are forced to approach the Centre for special funding. This gives the Centre the power to play favourites, and penalise those States which oppose it politically — affecting the federal structure of the country. This is precisely what the Modi Government is doing.[14]
Impact on Social Sector Spending of States
As discussed above, of the total total revenue of the Centre and States, the Centre collects roughly 70 percent, and the States’ own revenue is 30 percent. In contrast, the major part of the social sector expenditure in India is undertaken by the States — around 70 to 80 percent.[15]
To compensate for this imbalance, the Centre transfers a portion of its revenues to the States. But with the Centre resorting to collecting revenues as surcharges and cesses in order to deny States their rightful share in Central revenues, the total transfers to the States from the Centre as a percentage of the total revenues of the States has fallen to 42 percent in 2023–24 BE from 47.5 percent in 2020–21 A and 45.2 percent in 2015–16 A.[16]
If the Centre financially squeezes the States by reducing its transfers to them, then their social sector spending is obviously going to get hit.
This, plus the low spending of the Centre on the social sectors, is what is responsible for the abysmally low total social sector expenditures of the Government of India (Centre + States combined). It is less than 8 percent of GDP (as admitted by the Economic Survey 2023–24). This figure is one-third of the average for the OECD countries, and one-fourth of the social sector spending of the EU–27!
Notes
1. Source for OECD: “Social Spending”, https://data.oecd.org, accessed on 4 October 2024; for EU: Government Expenditure by Function – COFOG, https://ec.europa.eu; for India: Economic Survey, 2023–24. EU–27 figure includes general government expenditure on education, health and social protection (this includes sickness and disability, unemployment, old age, housing, etc). While the 2023–24 Economic Survey projects the social sector spending to be 7.8 percent and 8.0 percent for 2023–24 BE and 2022–23 RE respectively, the fact is, the Modi Government has been exaggerating its social sector expenditures in the Budget Estimates and Revised Estimates; based on the experience of past years, this figure should turn out to be around 7.5 percent when the actual figures come out in 2025.
2. The budget statement on subsidies also includes some other subsidies, under the heads ‘Interest Subsidies’ and ‘Other Subsidies’. They constituted 11% of the total subsidies. We are excluding them from our discussion.
3. Data for subsidies taken from Budget at a Glance, Union Budget Documents, various years.
4. Ibid.
5. For the Economic Survey’s definition of social sectors, see: Economic Survey 2023–24, p. 210.
6. Centre of Policy Research (CPR) is one of the national social science research institutes recognized by the Indian Council of Social Science Research (ICSSR).
7. For CPR’s definition of social sectors, see: “The Evolution of India’s Welfare System from 2008–2023: A Lookback”, Accountability Initiative, https://cprindia.org.
8. We have estimated the Modi Government’s social sector expenditures by adding up the budgetary outlay of the social sector related ministries. The CPR’s estimate for social sector spending as percentage of budget outlay is taken from: “Budget FY 2024–25 (Interim): The Last Decade of Social Spending”, Accountability Initiative, CPR, https://accountabilityindia.in.
9. Our calculation.
Own Revenues of States = Tax revenues of States + Non-tax revenues of States – Transfers from Centre to States + Non-Debt Capital Receipts of States. We have not included borrowings of States in this calculation. (This definition of ‘Total Revenues of States and UTs’ is in accordance with Table II.2, State Finances – A Study of Budgets, p. 5, RBI publication, December 2023, https://rbidocs.rbi.org.in.) Tax and Non-tax revenues of States, and Transfers from Centre to States taken from Table 100, Handbook of Statistics on Indian Economy 2023–24, https://rbi.org.in. Non-Debt Capital Receipts of States = Recovery of Loans and Advances + Miscellaneous Capital Receipts. Data for ‘Recovery of Loans and Advances’ taken from Table 101, Handbook of Statistics on Indian Economy 2023–24. Data for ‘Miscellaneous Capital Receipts’ taken from State Finances – A Study of Budgets.
Total Revenues of Centre + States = Own Revenues of States (as calculated above) + GTR of Centre + Non-Tax Revenues of Centre + Capital Receipts of Centre (including Borrowings). GTR of Centre taken from: Table 106, Handbook of Statistics on Indian Economy 2023–24. Non-tax Revenue of Centre taken from Table 93, Handbook of Statistics on Indian Economy 2022–23. Capital Receipts of Centre (including Borrowings), taken from: Budget at a Glance, Union Budget documents, various years.
Total Expenditures of States = Own Revenues of States (as calculated above) + Transfers from Centre to States + Gross Fiscal Deficit of States. Transfers from Centre to States taken from Table 100, Handbook of Statistics on Indian Economy 2023–24. Gross Fiscal Deficit of States given in Table 99, Handbook of Statistics on Indian Economy 2023–24. This figure of Total Expenditure of States matches with Table II.3, State Finances – A Study of Budgets, RBI publication, December 2023.
Total Expenditure of Centre + States = Total Revenues of Centre + States (as calculated above) + Gross Fiscal Deficit of States.
10. Data for Chart 7.5 taken from: Walking the Tightrope: An Analysis of Union Budget 2023–24, CBGA, Delhi, 2023, https://www.cbgaindia.org; and Revisiting the Priorities: An Analysis of Union Budget 2024–25, CBGA, Delhi, 2024, https://www.cbgaindia.org. Similar figures given in: “Finances of the Central Government (2019–20 to 2024–25)”, PRS India, 23 July 2024, https://prsindia.org. Note that GST cess is not included in this data, as it is meant for the specific purpose of sharing with States.
11. Source for Chart 7.6: Union budget documents, various years.
12. Our calculation. See also: “Finances of the Central Government (2019–20 to 2024–25)”, op. cit.
13. “Centre’s Cess Cleverness Is Taxing States”, 22 February 2024, https://www.deccanherald.com.
14. See for instance: C.P. Chandrasekhar, “Politics Over the Purse”, 20 August 2024, https://frontline.thehindu.com; Arun Dev et al., “Inside the Centre vs States Battle Over Funds”, 8 February 2024, https://www.hindustantimes.com.
15. Resource Sharing between Centre and States and Allocation across States: Some Issues in Balancing Equity and Efficiency, Institute of Economic Growth, July 2019, https://fincomindia.nic.in — this document gives the States’ share at around 80 percent.
16. Our calculation. Here, the Centre’s transfers to States include both the share of the States in Centre’s gross tax revenues, and the Centre’s transfers from its own budget outlay. Total Revenues of States = Tax revenues of States + Non-tax revenues of States + Non-Debt Capital Receipts of States. We have not included borrowings of States in this calculation. (This definition of ‘Total Revenues of States and UTs’ is in accordance with Table II.2, State Finances – A Study of Budgets, p. 5, RBI publication, December 2023, https://rbidocs.rbi.org.in.) For source of data, see Reference 9.
(Neeraj Jain is a social–political activist with an activist group called Lokayat in Pune, and is also the Associate Editor of Janata Weekly, a weekly print magazine and blog published from Mumbai. He is the author of several books, including ‘Globalisation or Recolonisation?’ and ‘Education Under Globalisation: Burial of the Constitutional Dream’.)